Car Depreciation in Australia: How Fast Does Your Car Lose Value?
Post by webuycars on 31 July 2026
The moment a new car leaves the dealership, it's already worth less than what you paid. It might sound alarming, but that's simply how car depreciation in Australia works. Understanding the curve properly can save you thousands, whether you're buying new, buying used or working out when to sell.
Australia's Car Depreciation Curve
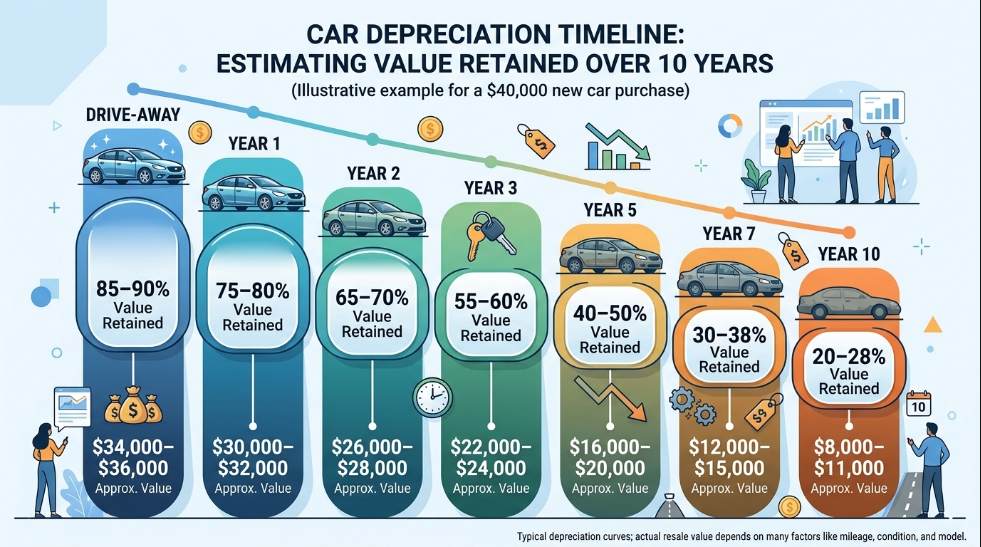
Most new cars lose 10–15% of their value the moment they're driven away, followed by a total drop of around 20–25% by the end of year one. The steepest losses happen across years one to three, after which the curve flattens considerably.
By year five, most mainstream vehicles sit somewhere between 40–50% of their original price.
Depreciation Year by Year: The Data
Here's roughly how a $40,000 car tracks over a decade, based on typical mainstream car depreciation patterns in Australia.
Reading Buyer Types
Year
% Value Retained
Approx. Value ($40k Car)
Drive-away
85–90%
$34,000–$36,000
Year 1
75–80%
$30,000–$32,000
Year 2
65–70%
$26,000–$28,000
Year 3
55–60%
$22,000–$24,000
Year 5
40–50%
$16,000–$20,000
Year 7
30–38%
$12,000–$15,000
Year 10
20–28%
$8,000–$11,000
These are general benchmarks only. Actual figures shift a fair bit depending on the model, its condition and market demand at the time of sale.
What Makes a Car Depreciate Faster or Slower
Car depreciation in Australia isn't uniform across the board. A handful of factors decide whether a specific vehicle holds up well or falls off a cliff.
Brand & Model Demand
Cars with strong local demand and a reputation for reliability tend to hold value better, simply because more buyers are chasing the same used stock.
Age & Kilometres
Higher km’s generally mean lower value, but the relationship isn't perfectly linear. Buyers often treat round numbers like 100,000 km as psychological cut-off points, so a car sitting just under that mark can be worth noticeably more than one just over it.
Condition & Service History
A full, documented service history reassures buyers and supports a higher resale price. Missing records, even on a mechanically sound car, tend to push buyers toward a lower offer out of caution.
Colour & Transmission
Neutral colours like white, black and silver typically hold value better than bold or unusual colours, since they appeal to a wider pool of buyers. Automatic transmissions also tend to depreciate slower than manuals in most segments, purely because more buyers want one.
Fuel Type
Fuel type has become one of the bigger depreciation factors in recent years, with hybrids and popular petrol models generally outperforming EVs in percentage retention, a point covered in more depth further down.
New-Model Release Cycles
The moment a manufacturer announces a refreshed version of a model, the outgoing version typically takes an immediate hit in perceived value, regardless of its actual condition.
The Cars Holding Their Value in Australia
Some vehicles buck the national depreciation trend almost entirely. The Suzuki Jimny is a standout, often retaining a huge share of its original price thanks to limited supply and strong demand.
The Toyota LandCruiser is another, with some near-new examples reportedly worth close to, or even above, their original price in certain conditions. The RAV4 and Corolla also perform consistently well, backed by Toyota's reputation for reliability and strong resale demand.
Utes and 4WDs generally hold up better than the national average too, because tradies, families and off-road buyers keep chasing them. If you're weighing up options before buying, checking used car values for your shortlist gives a clearer picture of which models are holding their price.
The Fastest-Depreciating Cars
At the other end of the scale, luxury European vehicles tend to depreciate the hardest in percentage terms, often losing well over half their value within three years. Orphan brands, models discontinued or pulled from the Australian market, also depreciate quickly since parts availability and resale confidence both take a hit.
EVs exposed to aggressive manufacturer price cuts have followed a similar pattern recently, with used values dropping sharply every time a new-car price is slashed. The resale value of Tesla in Australia is one of the clearest examples of this in the current market, and BYD’s resale value figures in Australia show a similar, if slightly less severe, pattern across several models.
EV vs Hybrid vs Petrol: The 2026 Reality Check
Right now, hybrids are the standout performers on retention, often losing only a small percentage in the first year. Mainstream petrol vehicles sit in the middle, while EVs currently depreciate the fastest. Frequent price cuts, fast-moving tech and a wave of off-lease vehicles hitting the used market are all pushing values down.
Depreciation and Tax: Prime Cost vs Diminishing Value
If you're using a vehicle for business purposes, depreciation can also be claimed for tax purposes using one of two ATO-approved methods:
The prime cost method, which spreads the deduction evenly each year.
The diminishing value method, which allows larger deductions earlier and smaller ones later.
Which method suits your situation depends on your circumstances. This is not tax advice. Be sure to check with your accountant or the ATO directly before applying either method to your own vehicle.
How to Slow Your Car's Depreciation in Australia
A few practical habits can meaningfully soften the curve on your own car.
Keep full, documented service records. Buyers and valuers both reward a clean history.
Avoid excessive kilometres where possible. Staying under common psychological thresholds, like 100,000 km, protects resale value.
Time your sale carefully. Selling before a model refresh or major price cut is announced protects your position.
Stick to neutral colours if buying new. It's a small decision at purchase time that pays off at resale.
When the Curve Says Sell
If your car's already past the steepest part of its depreciation curve, or you can see a model refresh or price cut coming, waiting longer rarely works in your favour. Getting an instant offer for a car through a licensed buyer saves you second-guessing the timing yourself.
The process starts with booking an assessment. Once your car's been looked at in person at our office, you'll get a proper offer based on current market data. If you've been searching for a we buy any car option that gives you a straight answer without the hassle of a private sale, this is generally the faster route.
FAQs
On average, expect around 15–20% in year one, tapering to roughly 10% per year through years two and three, before flattening out further in later years.
The Suzuki Jimny, Toyota LandCruiser, RAV4 and Corolla usually hold their value best, and so do popular utes and 4WDs.
Currently, yes. EVs are depreciating faster than petrol and hybrid vehicles in Australia right now, largely due to manufacturer price cuts and rapid technology turnover.
It's not a hard cliff, but buyers do treat it as a key psychological mark. Many buyers filter searches around this number, so value often drops more noticeably just after crossing it than the actual mechanical difference would suggest.
Generally, from around year five or six onward. The steepest losses happen in the first three years, after which the curve becomes much more gradual.
We Buy Cars is the easiest & most efficient way to sell your used car.
If you've been telling yourself "I need to sell my car", you're in the right place! Our team are waiting for your enquiry. Book today and get prompt and secure payment for your used vehicle.